Prometheus 및 node_exporter설치 및 설정 무작정 따라하기
Prometheus는 구성된 모든 대상 시스템에서 메트릭을 수집 할 수있는 오픈 소스 모니터링 시스템입니다. Prometheus는 강력한 쿼리, 뛰어난 시각화, 정확한 경고 기능을 갖춘 다차원 데이터 모델을 구현하며 많은 통합 기능을 제공 합니다. Prometheus는 원래 2012 년 SoundCloud에 의해 개발되었지만 이제는 오픈 소스 커뮤니티에서 독립적으로 유지 관리하는 독립적 인 오픈 소스 프로젝트가되었습니다.
모든 구성 요소는 Github의 Apache2 라이센스에 따라 제공됩니다.
Prometheus와 node_exporter를 설치하고 구성하는 방법에 대해여 설명드릴 예정입니다. Prometheus 모니터링을 설치 한 이후 클라이언트 서버에서 메트릭을 수집하도록 node_exporter를 구성합니다.
최근 회사에 MSA도입을 준비하면서 차후 많은 운영의 복잡성을 생각하다 보니 우리회사에서 비용을 안쓰고 오픈소스를 구축하는 방안이 뭐가 없을까? 라는 생각을 하다가 프로메테우스를 이용하여 메트릭 수집을 하여 처리하는 방식을 채택하여 사용하기 위한 실습입니다.
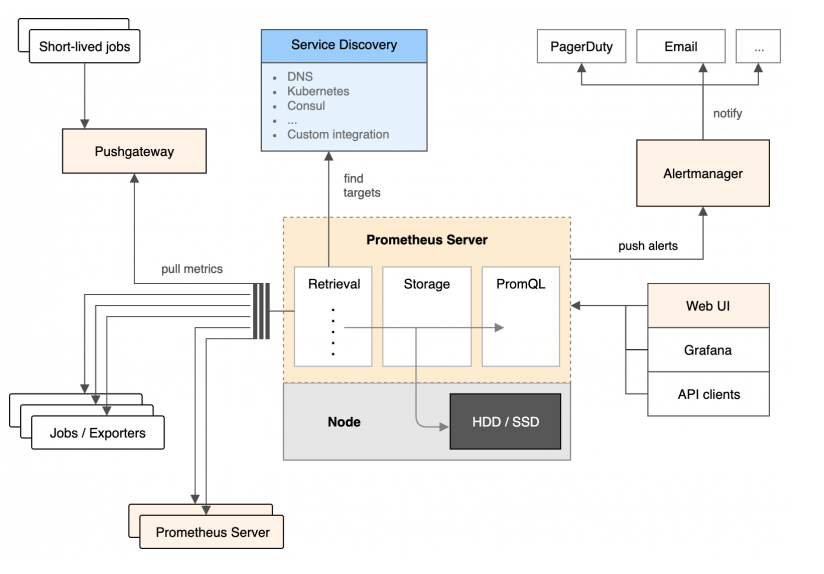
아키텍처 그림에서 보여지는 Prometheus의 주요 컴포넌트는 아래와 같은 역할을 합니다.
- Prometheus Server: 모니터링 데이터를 수집하고 저장합니다.
- Pushgateway: 배치나 스케쥴링으로 동작하는 어플리케이션의 경우 항상 실행되는 것이 아니기 때문에 해당 어플리케이션의 API를 호출할 수 없습니다. 이런 경우 해당 어플리케이션은 어플리케이션이 동작하는 동안 모니터링 데이터를 Pushgateway로 보내고, 추후 Prometheus server가 이 Pushgateway의 데이터를 수집하는 방식을 사용할 수 있습니다.
- Prometheus Web UI, Grafana : Prometheus에 저장된 데이터를 조회하거나 시각화하는 기능을 제공합니다.
- Alert Manager: 특정 룰을 이용한 알람 설정을 통해 알람 발생될 조건이 되면 설정된 Email이나 PagerDuty를 통해 알람의 내용을 전달할 수 있습니다.
- Exporter: 모니터링 데이터를 수집하고 Prometheus Server에서 수집 요청이 오면 모니터링 데이터를 넘겨줍니다. 이미 여러 제품 및 툴들을 위한 Exporter들이 만들어져 있으니 사용하시는 시스템에 따라 이미 만들어진 Exporter를 활용하실 수 있습니다.(https://prometheus.io/docs/instrumenting/exporters/)
전제조건
- 서버
- 루트 권한
학습내용
- 새 사용자를 만들고 Prometheus를 다운로드하십시오
- Prometheus를 시스템화 된 서비스로 구성
- 방화벽 구성
- node_exporter 설치 및 구성
- Prometheus 서버에 node_exporter 추가
- 테스팅
1단계 - 사용자 생성 및 prometheus 다운로드
Prometheus 서비스는 루트가 아닌 사용자로 실행됩니다. 따라서 시스템에서 루트가 아닌 새 사용자를 만들어야합니다. 'prometheus'라는 새 사용자를 만들고 모든 prometheus 서비스가 prometheus 사용자로 실행됩니다.
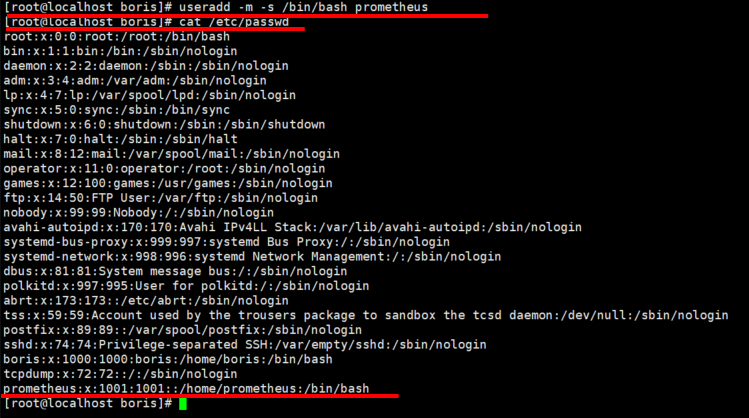
새로운 'prometheus'사용자를 만들어 주세요.
- useradd -m -s /bin/bash prometheus
- cat /etc/passwd를 이용하여 사용자가 정상적으로 생성되었는지 확인해주세요.
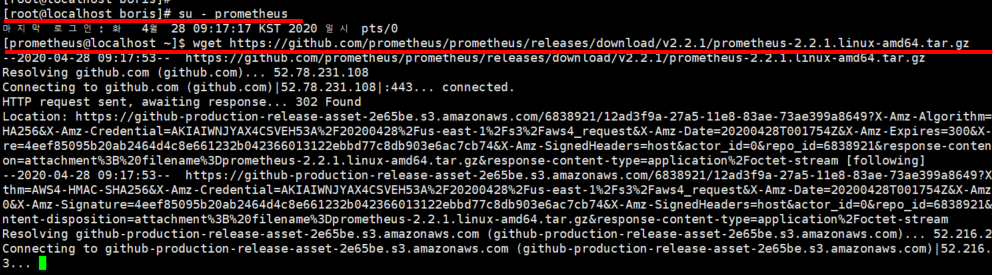
사용자에게 로그인하고 wget명령을 사용하여 prometheus를 다운로드해주세요.
- su - prometheus
- wget https://github.com/prometheus/prometheus/releases/download/v2.2.1/prometheus-2.2.1.linux-amd64.tar.gz
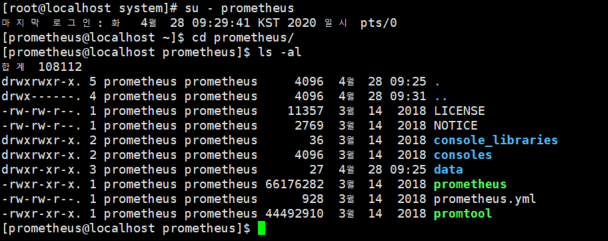
wget을 이용하여 프로메테우스 tar를 받으셨으면 tar을 이용하여 프로메테우스 파일 압축을 해제하고 이동하여 줍니다.
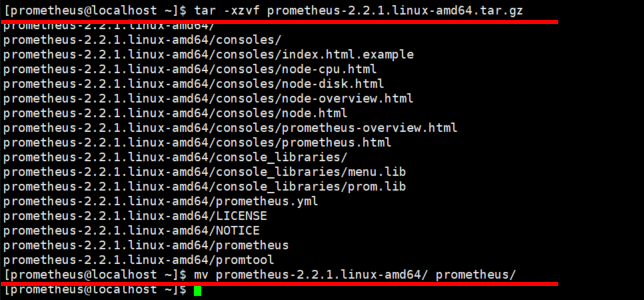
prometheus 파일은 '/home/prometheus/prometheus'디렉토리에 있습니다.
2단계 - 사용자 생성 및 prometheus 다운로드
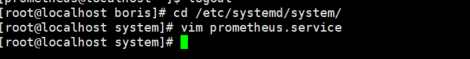
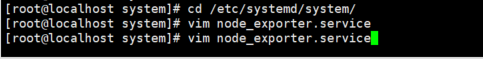
prometheus를 시스템 서비스로 구성합니다. '/etc/systemd/system'디렉토리에 새로운 서비스 파일 prometheus.service를 작성하여 줍니다.
해당 서비스 파일을 만들기 위하여 root 계정에서 작업을 진행하여야 합니다.
- cd /etc/systemd/system/
- vim prometheus.service
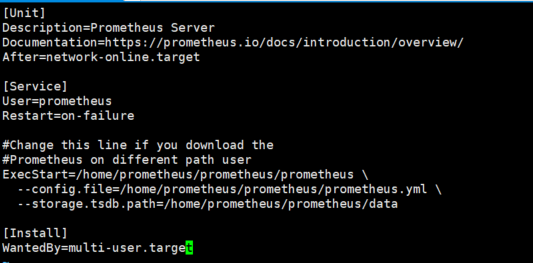
해당 내용을 작성하고 저장해주세요.
[Unit]
Description=Prometheus Server
Documentation=https://prometheus.io/docs/introduction/overview/
After=network-online.target
[Service]
User=prometheus
Restart=on-failure
#Change this line if you download the
#Prometheus on different path user
ExecStart=/home/prometheus/prometheus/prometheus \
--config.file=/home/prometheus/prometheus/prometheus.yml \
--storage.tsdb.path=/home/prometheus/prometheus/data
[Install]
WantedBy=multi-user.target
이제 아래 systemctl 명령을 사용하여 시스템 시스템을 다시로드하십시오.

이제 아래의 명령을 사용하여 프로메테우스 데몬이 실제 돌아가고 있는지 확인합니다.
- systemctl status prometheus

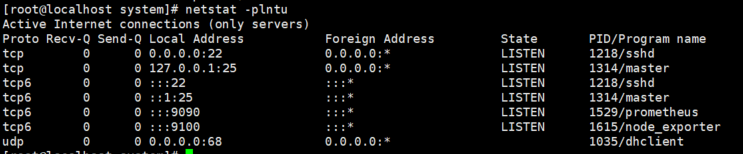
또는 네트워크 명령어를 이용하여 확인하셔도 됩니다.
- netstat -plntu

3단계 - Node_exporter 설치 및 구성
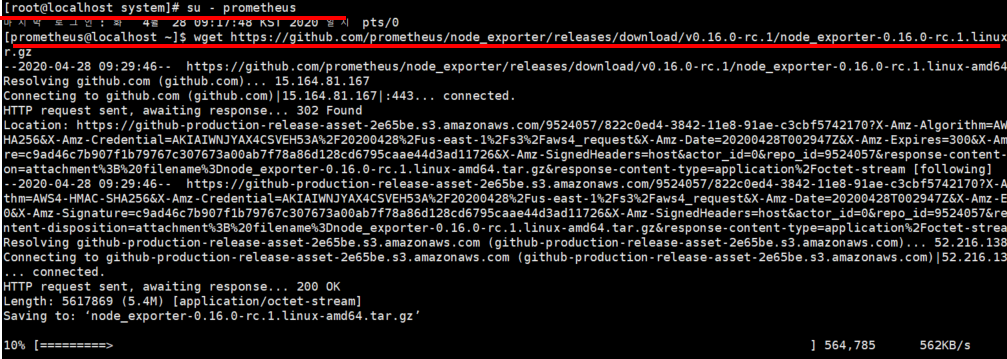
node_exporter는 Linux 시스템에서 실행할 수 있는 시스템 메트릭 내보내기입니다. prometheus서버에 node_exporter를 설치합니다. 우리는 prometheus 서버의 메트릭을 모니터링하고 매트릭을 수집 할 것입니다. prometheus 사용자로 로그인하고 wget 명령을 사용하여 'node_exporter'를 다운로드하십시오.
- su - prometheus
- wget https://github.com/prometheus/node_exporter/releases/download/v0.16.0-rc.1/node_exporter-0.16.0-rc.1.linux-amd64.tar.gz
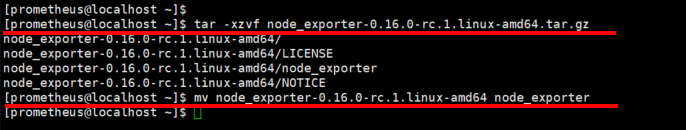
wget을 이용하여 노드익스퍼트 tar를 받으셨으면 tar을 이용하여 노드익스퍼트 파일 압축을 해제하고 이동하여 줍니다.
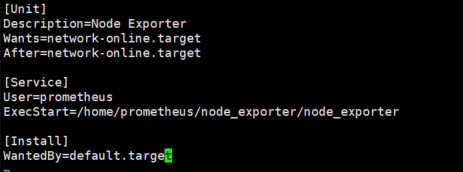
해당 내용을 작성하고 저장해주세요.
[Unit]
Description=Node Exporter
Wants=network-online.target
After=network-online.target
[Service]
User=prometheus
ExecStart=/home/prometheus/node_exporter/node_exporter
[Install]
WantedBy=default.target
- systemctl daemon-reload
- systemctl start node_exporter
- systemctl enable node_exporter

- netstat -plntu
4단계 - 서버에 node_exporter 추가
node_exporter를 prometheus 서버에 추가합니다. prometheus 사용자로 로그인하고 구성 'prometheus.yml'파일을 편집하십시오.
- su - prometheus
- cd prometheus/
- vim prometheus.yml
'scrape_config'줄 아래에 아래 구성을 복사하여 붙여 넣어 새 job_name node_exporter를 추가해주세요.
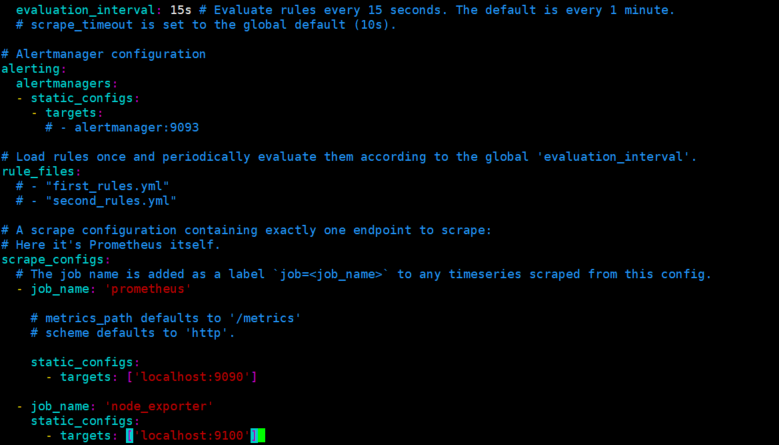
node_exporter가 prometheus 서버에 추가되었습니다. 적용을 하기 위하여서는 프로메테우스 서버를 재시작해줍니다.
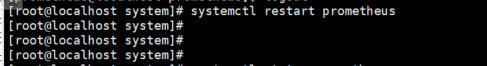
- systemctl restart prometheus
5단계 - 서버에 node_exporter 방화벽 설정
- firewall-cmd --add-port=9090/tcp --permanent --zone=public
- firewall-cmd --add-port=9100/tcp --permanent --zone=public
- firewall-cmd --reload
- firewall-cmd --list-all
6단계 - 서버에 node_exporter 테스트
웹 브라우저를 열고 서버 IP 주소를 입력하십시오.
http://설정하신 IP:9090/
쿼리 필드에 meminfo 수집기 'node_memory_MemAvailable_bytes'를 입력하고 '실행'버튼을 클릭하십시오.
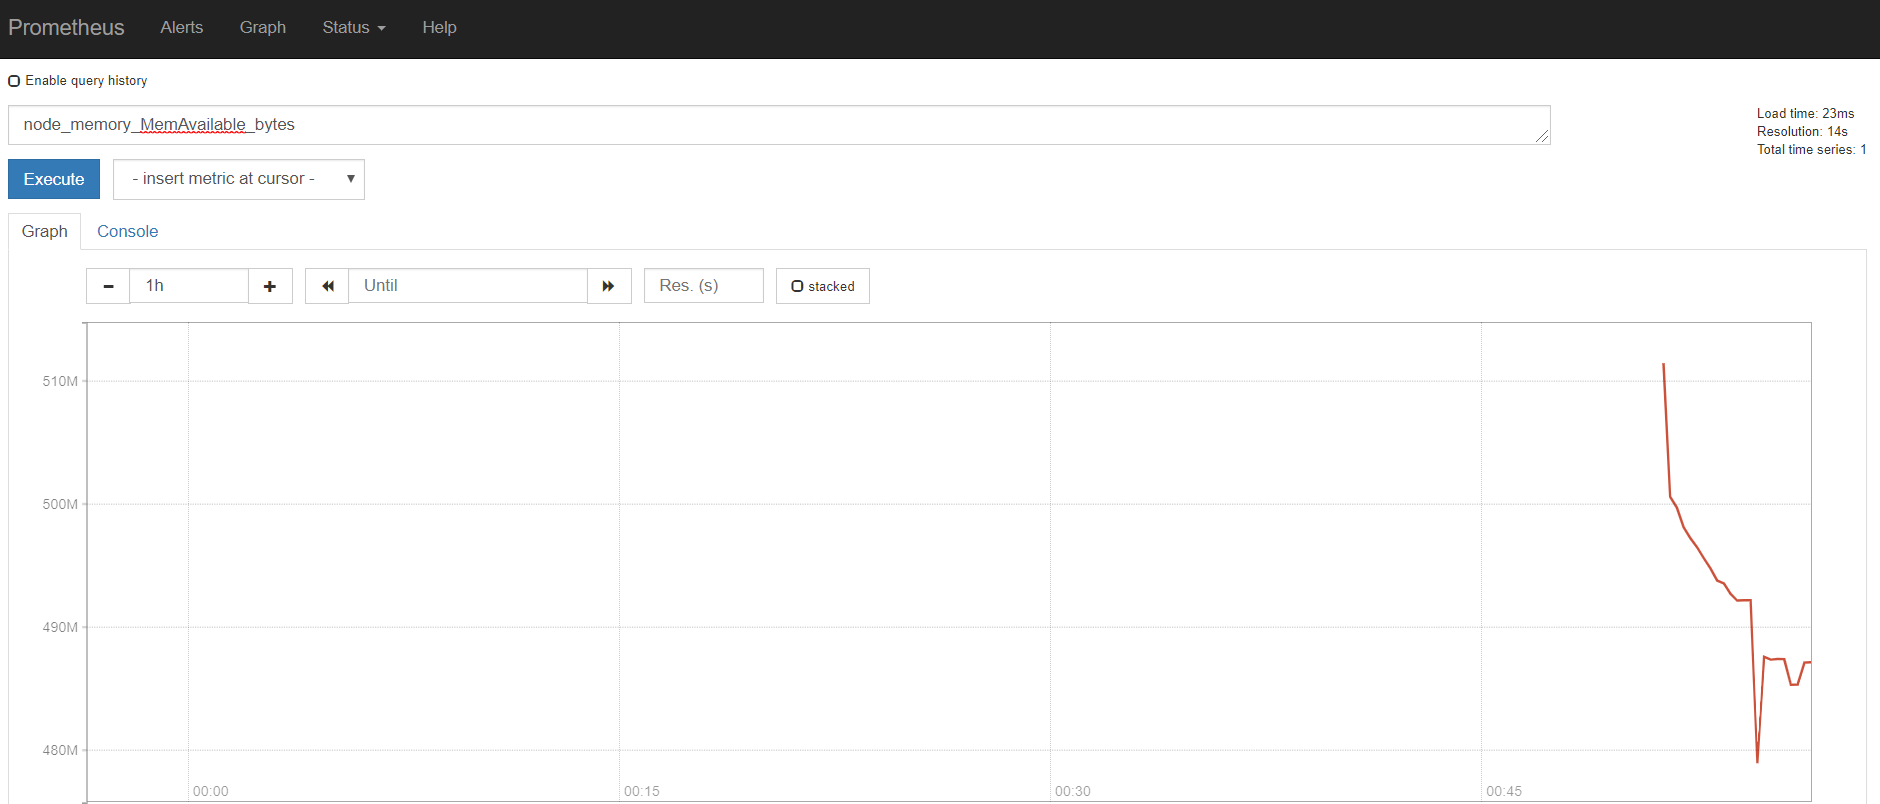
이렇게 하면 서버와 노드_익스퍼트 간의 테스트까지 완료가 되었습니다.
관련하여 궁금하시면 제가 아는 한도에서 성심성의껏 답변 할 수 있도록 하겠습니다.
참고문헌
https://prometheus.io/docs/prometheus/2.2/getting_started/
https://prometheus.io/docs/prometheus/2.2/configuration/configuration/


댓글
댓글 쓰기